KPIs are shorthand for linked Key Performance Indicators. Not all railroad industry KPIs are internalized data. In fact, the best KPIs come from non-railroad sources. Internal railroad data is important. But its value appears when cross-checked with other sources. Here, the prime research source is the Association of American Railroads (AAR) monthly report card.
While a trade association is normally a promoter, the AAR has a highly educated and skilled economics group that probes internal industry data (much of it confidential) and then directly addresses that data against a broad range of non-industry data. The result is a monthly report—Rail Time Indicators. This report provides hard trend evidence that I have shared during my long engineering and management career with students. Let me share it with you.
Over decades, AAR has created excellent statistical and graphic coverage of railroading as a business. To subscribers, it then relates that to the rest of the commerce data. No other global or national association of railroad operating companies provides an equivalent continuous measurement of rail industry-wide commercial activity straight up against other trending and changing economic indicators, not on such a rapid-after-the-past-month fashion. This AAR resource makes studying North American freight an interesting and up-to-date opportunity. Therefore, when you are asked to comment about the business volume outlook, this is the place you should start.
Here is this week’s first question. How does AAR see the market trend for North American freight? Let’s start with AAR’s end of October 2019 status report, which makes this clear statement: “A combination of a weak domestic manufacturing sector, feeble economic growth abroad that’s limiting exports, continued trade spats that are disrupting global supply chains, and general economic uncertainty are creating strong headwinds for U.S. rail volumes.” Few economists disagree.
Here are the internal railroad industry KPIs. In round numbers:
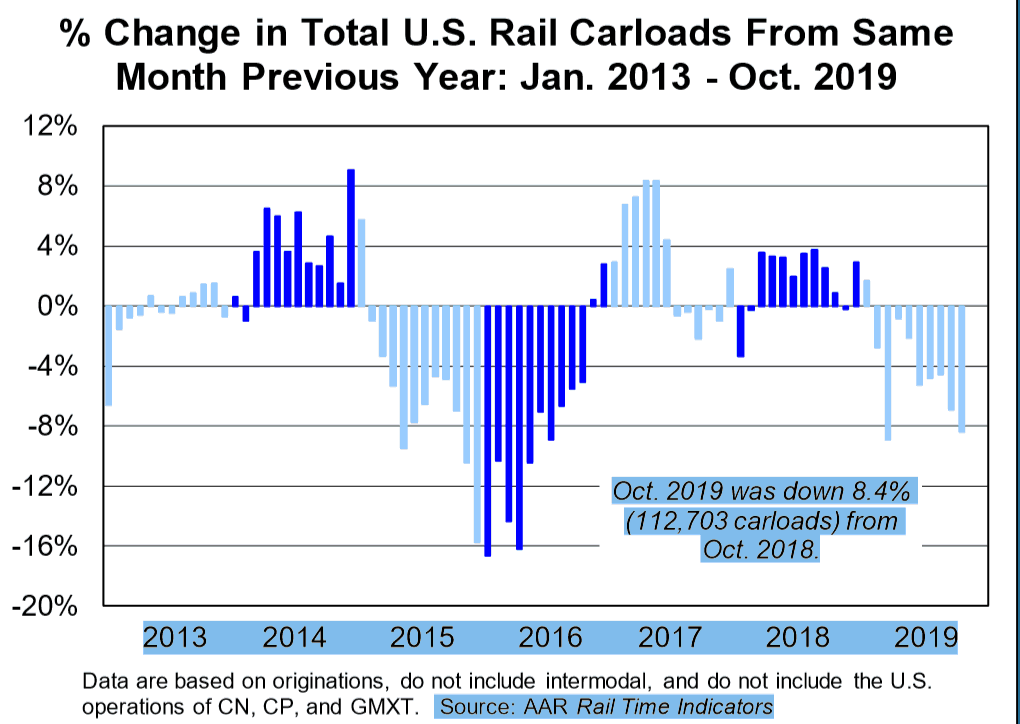
October total U.S. rail carloads were down 8.4% year-over-year. That marks the ninth straight monthly decline. Only four of the 20 carload commodity types that AAR tracks had positive gains in October. The markets with the largest volume declines were coal (down 15%); motor vehicles and parts (down 10%, due primarily to the United Auto Workers strike at General Motors); crushed stone/sand/ gravel (down ~ 7%); and grain (down 6%). Take coal volume out, and U.S. October carloads were still down by just over 5%.
Here is a graphic summary of the years through October between 2013 and 2019:
How Bad Is This?
This newest-score carload drop is “the biggest percentage decline since January 2016.” These multiple three- to five-year slope changes are important to watch. Do not get lost in the weekly change numbers. That is “noise.”
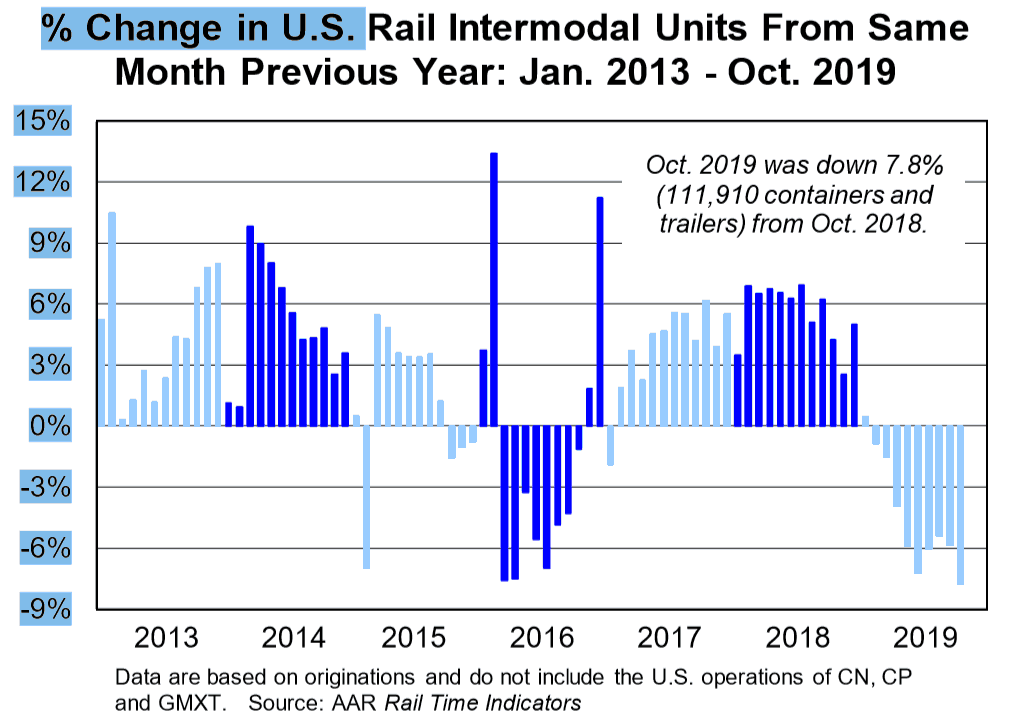
Meanwhile, the next “star” for strategic rail traffic growth was supposed to be intermodal. However, intermodal continues to stumble. That is bad news when the keystone of growth hits a wall. October 2019 intermodal volume was down just under 8%. A combination of pricing and competition from trucking has stalled the rail intermodal “take trucks off the highway” plan.
Over a three-year period, that’s the biggest percentage decline in intermodal since the great recession period of January 2009. Ouch! Are we paying attention? Follow the changing multiple-year slope changes in this AAR seven-year graph:
Given this graphic’s shifting patterns of trend lines, what should your tactical railcar buying decision be—remembering the implications of long-term strategic cost of capital? Please think in both timelines.
Focusing On The U.S. Railroad View
The AAR summarized the state of the U.S. economy by quoting a New York Times analysis from Nov. 2: “The October jobs report and other recent data paint a picture of a job market that is weathering the storm of trade tensions and a cooling global economy. The manufacturing sector is in a slump, business investment is falling, and overall economic growth has slowed this year.”
Upon further review, this railway economist agrees.
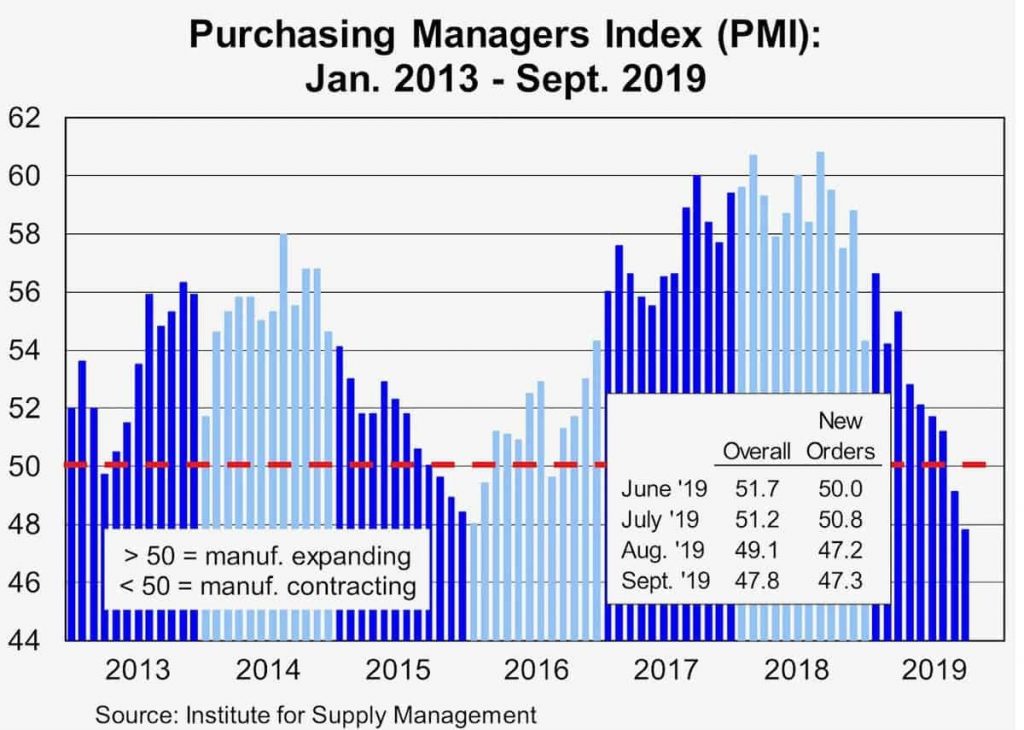
The AAR believes the Purchasing Managers Index provides a longer term specific KPI to watch for freight:
A slightly different view is acknowledged by the AAR research staff in this graphic. The offset is that U.S. consumers are still spending, while employers are still hiring.
But can consumer consumption support rail freight? And if so, for how long? Those are big and unanswered questions.
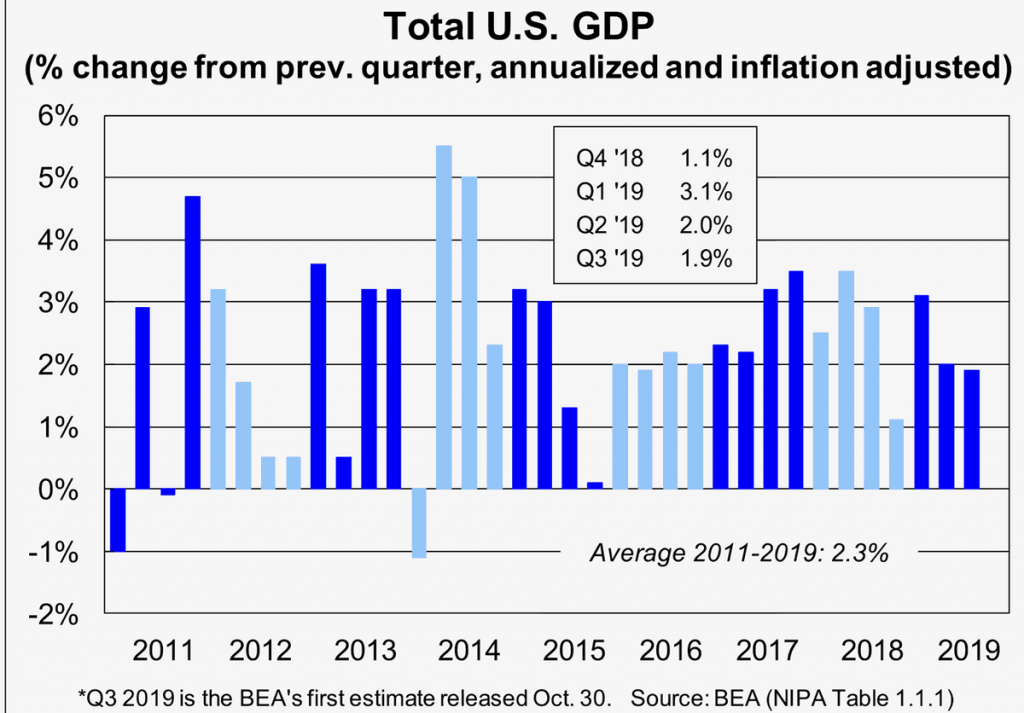
Will there be a full-blown recession in the United States over a period of two quarters or more? The railway data does signal “a recession ahead.” But is rail freight as relevant a recession predictor as it was in past decades? Maybe. Maybe not.
Third-quarter 2019 U.S. GDP might have dropped to about 1.9% from the previous two quarters’ higher percentages. Will fourth-quarter 2019 GDP drop below the third quarter? We may not know the answer until late January 2020.
Tick… tick… tick… with 13% of the weeks to go. Practically speaking, there are only six to seven good weeks left in the year for rail traffic to show signs of an economic recovery.
Courtesy of the AAR, here are a few of the most critical economic graphics that experience suggests show the trending economic outlook for the U.S. economy. When you look at these, please pause. Eyeball the changing long-term vs. most recent two to four period patterns of change. Imagine the slope of the declining/increasing trend line. That pause is you, the reader, as a moment to capture the forecast insight for your judgement.
The past is not necessarily prologue. True. But ignore the past and the slope pattern at your due diligence risk.
Solutions For Improving Share And Earnings
How might the U.S. railroads react to these trade wind doldrums? Start here. In a down market with hard movement assets on hand, Economics 101 principles suggest marginal price selling. Translation? With nearly 23% of freight cars in storage, one action to generate modal shift demand would be to selectively discount traffic rates on higher-margin lanes.
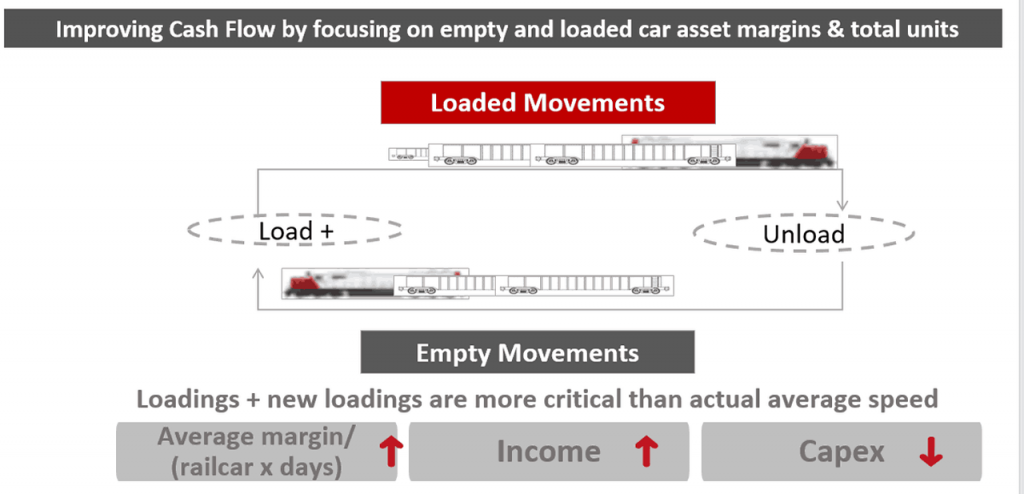
To execute this, rail costing systems should calculate the difference between empty car movements and loaded car movements at a rather precise movement level. Not every railroad company cost system does this easily. However, the objective is simple: Try to maximize car loaded time and loaded distances—plus increase the total revenues earned by fleet space technically available to sell. That generates more net cash flow if done accurately. Why? Because freight cars owned (or leased) are in short-run periods, almost liked fixed costs.
The equation is to attack the variability function of marginal added units that could be loaded, multiplied by added revenue per fixed-cost car platform.
Rod Case of Oliver Wyman has repeatedly emphasized this in his many Rail Equipment Finance presentations. This message at the REF March meeting is a critical repeating one by Rod and his colleagues:
Lots of stored or “off-line cars” isn’t a good news story. It represents unused assets that could be sold as discounted yet still-profitable margin traffic. Instead, the owners in effect pay a parking lot charge to keep their balance sheet asset count low—all while rail market share vs. trucking continues to drop, and getting customers back to rail after their switch to trucks is a near hopeless task.
Rod Case’s strategy is complemented by Alta Rail Technology’s Dany Maron, whose profitability perspective in part looks at stored- or fixed-fleet-size assets as opportunities for generating higher cash flow.
Freight cars are really the platform required to move more freight. North American railroads have spent decades improving track asset capacity. But the asset that can generate more volume and more marginal return is the freight car. The formula is simple.
But not everyone’s railroad costing system captures the magic margin numbers that peer inside the empty car fleet to seek out the incremental cash generation from existing car assets. That’s where Alta Rail offers its insight tool that couples onto the now GPS-locational data from PTC. That’s the next IT step to improving shipper service as well as rail earnings. The opportunity is there. Who will seize it first by managing their big-commodity-flow database?
The accounting redirection is straightforward. Heavier loadings per year from current cars directly increases cash flow—a true measure of earnings, even in these tough times. The accounting techniques support both PSR and non-PSR business models.
Imagine, if you will, the outcome if rail leadership could accelerate boxcar and other types by increasing total load cycles per year of the existing fleet—just like they did with intermodal units, as seen in this timeline graph of Loaded Car Moves per year by type of North American freight car. Graphic courtesy of Alta Rail Technology, Dany Maron.
Can you say wow!?
Wrap-up
Experts calculate that nominal North American freight railcar fleet replacement is in the 40,000 to 45,000 railcars built-per-year rate. That’s a sound expectation. The most recent lowest level of railcar replacement occurred back in the Great Recession, when railcars delivered dropped to about 18,000 units during 2010.
Susquehanna Financial Group’s Bascome Majors sees the current 2019 rail market this way: Heading into the fourth-quarter 2019, the traffic level is clearly down. Admittedly, full-year 2019 might still record a rather healthy delivery of 60,000 railcars. Why so high? Because the manufacturers are working off previous years’ backorders, when projections by the railroads were more optimistic.
Looking ahead into 2020, the actual new railcar orders might drop below the calculated fleet replacement level. Two exceptions exist. One is grain car orders, which could possibly surge as early as the first-quarter 2020 if rumors of “huge Chinese grain orders” in fact occur due to a new U.S./China trade agreement.
But beware: Huge gains in grain orders are currently speculative. If a railroad orders a railcar with a 35- to 45-year lifespan, the potential grain deal with China should have a similar “long life certainty.” Why? Because the capital investment or financing for that railcar will last a long time.
The second upside exception is that specialty tank cars to move chemicals, plastics, liquified natural gas, crude oil, etc. could be the next sector favored for high railcar orders. Indeed, that is a likely rail growth sector.
The downside? TTX, a pool railcar company, still faces a dilemma in determining the future of both the slow-growth boxcar as well as the strategically expected high growth intermodal car market. As of early in the fourth quarter, it’s hard to see the collective railroad company owners of TTX approving any significant new intermodal or boxcar orders for 2020.
Until loaded car cycles per year increase by a magnitude of 20% or greater, the future of the boxcar fleet remains negative. There is no high rate of return for boxcar owners. Perhaps it is time for boxcar-dependent users like paper products shippers to invest in managing their own shipper boxcar pool? Buy a large percentage of the TTX boxcars and create a shipper-managed and -financed pool of boxcars. That might protect the shippers’ needs.
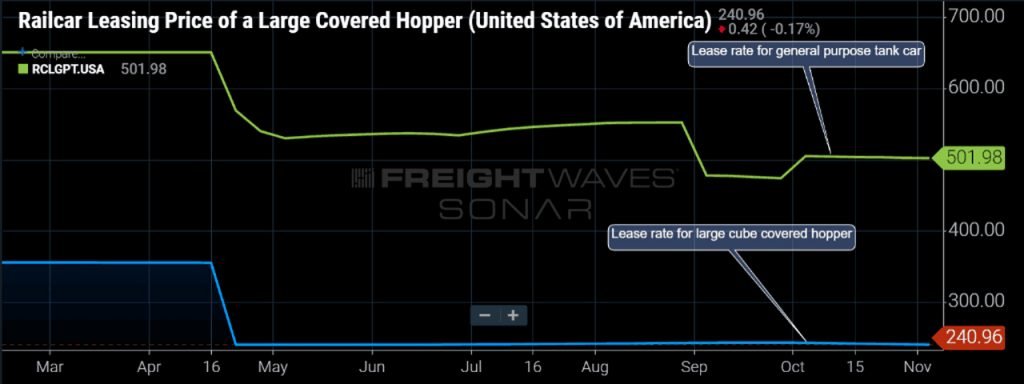
Finally, as a reminder, stored railcars require continuing debt and interest payments by someone. Even leased railcars have monthly payments, as well as a “parking fee” now. Entrepreneurs turn such lemon-like circumstance into business lemonade.
A FreightWaves SONAR graph illustrates the differences in freight car values that, regardless of good or bad times, are financial risk:
Railway colleagues, who is going to be the first to finally drive empty cars into the higher-profit opportunities? How are they going to do it? Figure that out, and there might be the next renaissance for railways. Otherwise, railroaders might sit, watch and wait for a random trade winds shift.
Acknowledgements
For more about the AAR monthly graphs and critiques, contact Dan Keen in the Policy and Economics Department of the Association of American Railroads.
For more detail about maximizing railcar assets, reach out on LinkedIn to Dany Maron at Alta Rail. Or separately, reach out to Rob Case, a partner at Oliver Wyman.
Independent railway economist, Railway Age Contributing Editor and FreightWaves author Jim Blaze has been in the railroad industry for more than 40 years. Trained in logistics, he served seven years with the Illinois DOT as a Chicago long-range freight planner and almost two years with the USRA technical staff in Washington, D.C. Jim then spent 21 years with Conrail in cross-functional strategic roles from branch line economics to mergers, IT, logistics, and corporate change. He followed this with 20 years of international consulting at rail engineering firm Zeta-Tech Associated. Jim is a Magna cum Laude Graduate of St Anselm’s College with a master’s degree from the University of Chicago. Married with six children, he lives outside of Philadelphia. “This column reflects my continued passion for the future of railroading as a competitive industry,” says Jim. “Only by occasionally challenging our institutions can we probe for better quality and performance. My opinions are my own, independent of Railway Age and Freightwaves. As always, contrary business opinions are welcome.”


Comments are closed.